ATEasy provides the ability to easily log test data which can then be analyzed to identify failure rates, yields, and pass/ fail trends. The use of 3rd party data analysis tools can greatly simplify this process compared to using conventional IT solutions which are deficient in several key areas:
1. File based data systems although simple, do not provide data management, search, or querying capabilities.
2. Database systems allow querying but are not flexible, require database administrator skills and effort, and can perform poorly
3. Basic data management methods do not readily support the extraction of trends and metrics from test data
4. Tools like Excel provide basic charts but no interactivity or ability to drill down
5. Dedicated reporting tools are expensive, not flexible, and often require coding to integrate
Organizations many times, are left to build their own data management infrastructure and applications, specifically for their own system and data requirements. And while this approach may meet their needs, such systems are not scalable and useable across multiple devices or production lines. A better solution is to consider a test data management tool that can be easily integrated with test software such as ATEasy. Verifide PASS is a a test management platform that can provide you with extensive capabilities for analyzing your test data.
Designed with these requirements in mind, Verifide allows you to keep your tests in ATEasy while easily adding comprehensive data management and analysis tools to your existing systems.
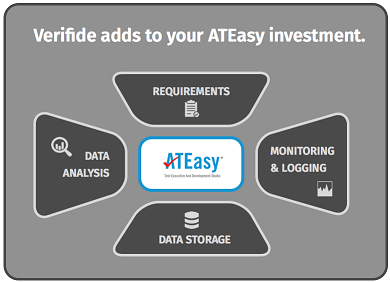 Figure 1:The PASS software fits around your existing ATEasy tests Figure 1:The PASS software fits around your existing ATEasy tests
The PASS software by Verifide is a complete test platform that provides a comprehensive test infrastructure, data management and visualization tools, including the following capabilities:
1. The ability to store rich data such as tables, arrays, and images.
2. The power to search, access, and analyze test data locally or from a remote computer or via a web application
3. Requires no database design or administration because the database is built dynamically as data is stored
4. Visualize data and identify trends and drill down into raw data for troubleshooting/analysis
5. Compare/overlay test data and plots
6. Generate reports from tests with no code
The PASS software is a highly modular and scalable architecture. With the PASS platform, there is no database setup and you can continue to use the same framework and applications to manage data for any and all of your test systems. You can use it on one computer, or deploy through secure corporate IT firewalls with hundreds of users.
With the event-driven architecture of ATEasy, the integration of the PASS data management system into your existing test systems is easily done. By simply adding the driver, your test results will be pushed to the database and the PASS applications will allow you to view trend data as well as generate reports.
For a more hands-on demonstration of how to integrate the software and use the data analysis tools, you can view ATEasy integration video at:
https://player.vimeo.com/video/157803873
Note: The example below assumes that the ATEasy software development platform is already installed.
Step 1: Install the PASS softwareGo to http://www.verifide.com/web/ateasy.html to register and get a download of the 30 day trial software.
You will be sent a download link and installation guide to complete the installation. The example is available here for download.
Step 2: Add the driver to your ATEasy System.First add the driver to the project by navigating to the $(InstallDir)\Samples\ATEasy\ folder and selecting the PASSDriver.drv file
This will load the driver with defaults and import all needed libraries automatically
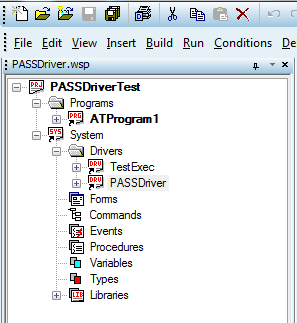 Figure 2: The driver will be added to the project Figure 2: The driver will be added to the project
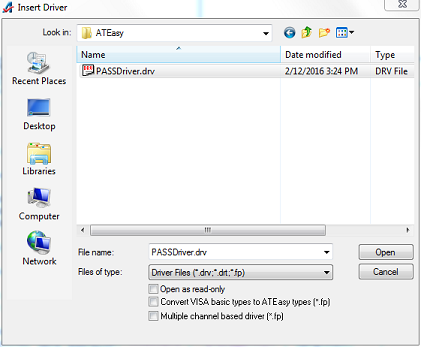 Figure 3: Select the driver file to add to the System Figure 3: Select the driver file to add to the System
Step 3: Configure any options using driver parametersThe PASS Driver allows you to configure options and override the default settings. Right click on the [PASSDriver in the System\Drivers and choose Properties, then go to the Misc tab to set these options.
By default, the driver is ENABLED, Test data and Program summary record are stored to the Database, and PASS run-time services are disabled (for events/alarms/services) so you can get started without requiring any additional applications to be started/stopped.
If you wish to disable the driver entirely, set the ALL_OFF parameter to 1
Data is stored by default to a Database named ATData. If you wish to store to another Database, set the DB_NAME parameter in the driver settings, or use one of the available driver commands to set it.
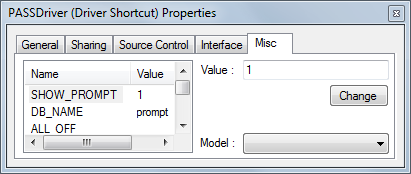 Figure 4: The driver has various options that you can control Figure 4: The driver has various options that you can control
Step 4: Run your tests.By default, data storage is enabled and you should not need to do anything. The PASS driver will key off of the ATEasy event-driven mechanism and store the data automatically (You do not need to do any DB or parameter setup upfront)
If you choose to store additional data, in addition to the TestResult, such as arrays, images, etc. then you can use the commands in the driver to do so. You can also use the driver to log activity or debug data for later analysis.
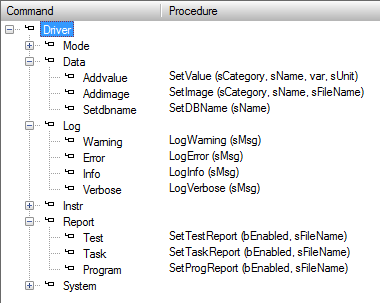 [ Figure 5: The driver has commands to add data, log messages, and configure options
 Figure 6: The driver commands can be used to add additional results to the test record or to log information messages to the log Figure 6: The driver commands can be used to add additional results to the test record or to log information messages to the log
Step 4: Consuming the dataOnce the results have been stored, you can view them using the PASS Vision application. This can be located in Start->All Programs->Verifide->Applications->Vision
When the application opens up, you will be asked to login. The default, Readonly, account is vguest and does not have a password, so leave it blank.
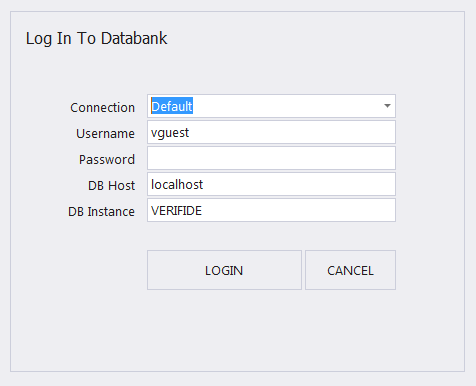 Figure 7: The vguest account does not need a password to read data from the database Figure 7: The vguest account does not need a password to read data from the database
This will bring up a Dashboard and show you all the existing databases and a quick snapshot of the test volume etc. If you wish to learn more, you can play around with the DEMO database to explore the full capabilities of the PASS data platform.
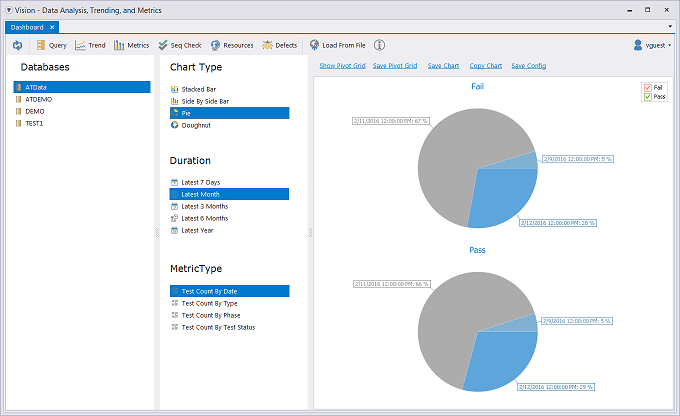 Figure 8: The dashboard shows all the current databases and allows the user to choose what analysis to perform Figure 8: The dashboard shows all the current databases and allows the user to choose what analysis to perform
Viewing test resultsTo view past results by time or test name etc, first select the database name, then click on the Query button in the Dashboard. This will bring up a list of previous results. Clicking on a result will allow you to view the raw data and/or report for the test
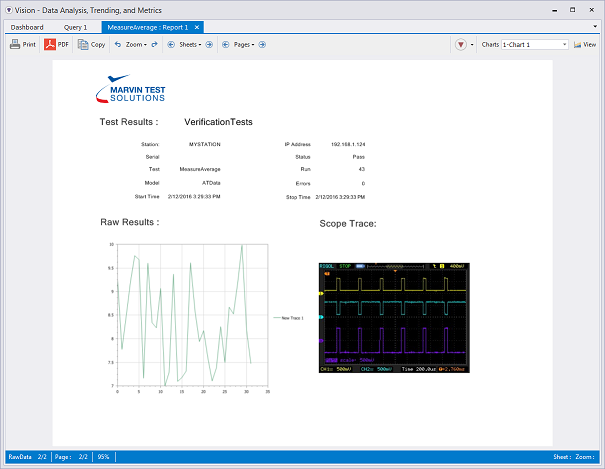 Figure 9: The PASS reporting framework allows you to create custom templates with charts, tables, images etc. Figure 9: The PASS reporting framework allows you to create custom templates with charts, tables, images etc.
TrendingWith the PASS data management, you automatically get the ability to observe data trends across runs. To perform a trend, select a database from the dashboard and click on the Trend button.
Here, you will first select a test or tests whose results you want to analyze for trends. Then select the data items such as TestResult to trend. To define the data set, you need to then perform a query – the easiest way to do this is using the Quick Query button at the top.
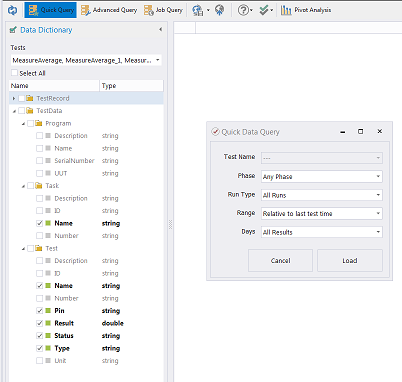 Figure 10: The Trend application allows selection of result fields to create a trend table Figure 10: The Trend application allows selection of result fields to create a trend table
Clicking on the Load button will mine all the data items from the results available and present it to you in a table. You can then further analyze the data visually using the chart button at the bottom of the table.
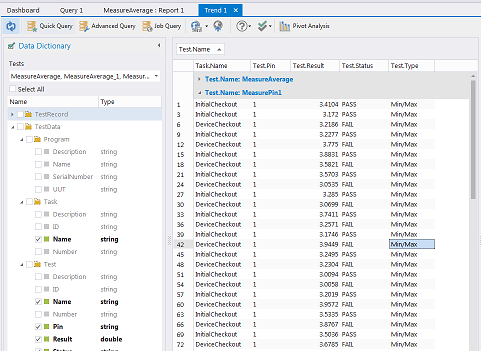 Figure 11: The trend table shows tabulated result values based on your query Figure 11: The trend table shows tabulated result values based on your query
From the trend table, if you click the Chart icon at the bottom of the page, then it will bring up a chart viewer for you to see all your test results plotted in a trend line.
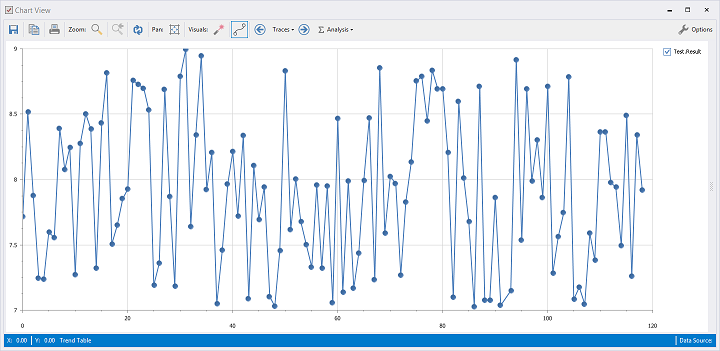 Figure 12: The trend table values can be plotted and you can zoom in and export the chart as well. Figure 12: The trend table values can be plotted and you can zoom in and export the chart as well.
MetricsMetrics are important to viewing your overall test process and volumes. PASS provides this feature out-of-the-box with customizable pivot tables and analytics. For more information, please visit our main website to watch our product intro videos, or refer to our comprehensive help file.
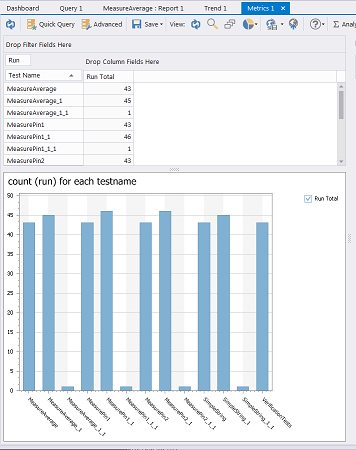 Figure 13: Metrics allow you to view process information and statistics Figure 13: Metrics allow you to view process information and statistics
SummaryUsing Verifide with ATEasy offers a complete test solution. Verifide provides the tools you need across your testing process- from data analysis to data storage, including monitoring and execution requirements.
Learn more at http://www.verifide.com.
|