ATEasy provides extensive tools to allow you to debug your code. These include the following commands:
● Continue
/ Pause ![]() (F4) – continues or pauses the debugged
application.
(F4) – continues or pauses the debugged
application.
● Abort
![]() (ALT+F5) – aborts the debugged
application.
(ALT+F5) – aborts the debugged
application.
● Doit!
![]() (CTRL+D) – executes the current
code view selection. If no code is selected, the whole content of the
code view is executed. The command is available only when the current
view is code view (in the Tests view or Procedures view).
(CTRL+D) – executes the current
code view selection. If no code is selected, the whole content of the
code view is executed. The command is available only when the current
view is code view (in the Tests view or Procedures view).
● Step
Into ![]() (F8)
– allows you to execute your code line by line. Step Into executes the
current line and pauses. If the line is an ATEasy
procedure, ATEasy pauses before executing
the first line in the procedure.
(F8)
– allows you to execute your code line by line. Step Into executes the
current line and pauses. If the line is an ATEasy
procedure, ATEasy pauses before executing
the first line in the procedure.
● Step
Over ![]() (F10)
– is similar to Step Into, however, if the current line is a procedure
ATEasy executes the procedure as a unit
and pauses after the procedure is returned.
(F10)
– is similar to Step Into, however, if the current line is a procedure
ATEasy executes the procedure as a unit
and pauses after the procedure is returned.
● Step
Out ![]() – executes the remaining code
of the current procedure and pauses at the next statement following the
procedure call.
– executes the remaining code
of the current procedure and pauses at the next statement following the
procedure call.
● Toggle
Breakpoint ![]() (F9)
– sets or removes a special mark in your code to tell the debugger to
pause when this line begins execution.
(F9)
– sets or removes a special mark in your code to tell the debugger to
pause when this line begins execution.
● Run
to Cursor  – sets a temporary breakpoint at
the current insertion line and then continues execution.
– sets a temporary breakpoint at
the current insertion line and then continues execution.
Several debugging Windows are also available. These let you watch the value of the application variables during execution. The following debugging windows are available:
● Call
Stack/Globals  – displays variables values of modules variables and procedures variables
when the application is paused. The user can change the values of variables.
– displays variables values of modules variables and procedures variables
when the application is paused. The user can change the values of variables.
● Watch
![]() – allows you to type expressions to evaluate their value. ATEasy
calculates and displays the value of the expression every time the execution
pauses.
– allows you to type expressions to evaluate their value. ATEasy
calculates and displays the value of the expression every time the execution
pauses.
Other debugging commands and windows are available from the Run and Debug menus and the View menus.
ATEasy contains two execution modes
when executing code from the IDE. You can select lines from the code view
and execute them – this is called Selection
Run Mode. Alternatively, you can execute the application or a portion
of your application (for example, a test). This is called Application
Run Mode. You can start debugging using Selection Run Mode when
the active view (the view with the input focus) is the code view. Use
the Doit!  ,
Loopit!
,
Loopit!  ,
Formit!
,
Formit!  ,
and step commands. If the active view is not a code view, run mode is
always used.
,
and step commands. If the active view is not a code view, run mode is
always used.
1. Activate the Average test code view by clicking on the test code view.
2. Select the Step Over
command from the Debug menu. ATEasy executes the code in the test. Since
no code was selected, all the test code in the view will be compiled and
scheduled for execution. ATEasy pauses
before starting the execution and the code view mark area (the left bar)
displays a yellow arrow showing where the execution paused. This in the
Next Statement Mark as shown here:
![]()
3. Click Step Over. At this point, the next statement advances to the assignment statement.
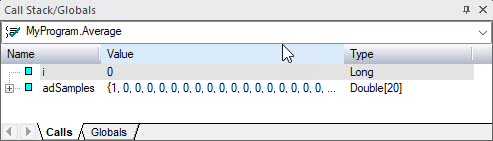
4. Select Call Stack from the View menu. The Call Stack window is displayed. Notice the current module variable and their values are displayed. i should be zero and the array adSamples elements should all be zero.
5. Click Step Over.
At this point, the next statement advances to the assignment statement.
The first element of the array should be set to 1
as shown here:
You can repeat this step to see how the value of the program variables
changes as you step through the code.
6. Set the insertion point to the line containing the call to the Average procedure. Select Run to Cursor from the Debug menu. ATEasy continues the loop and pauses before calling the procedure, filling the array elements values from 1 to 20. You can expand the array in the Call Stack window to see the array elements by clicking on the + sign next to the array.
7. Select Step Into from the Debug menu. A new document view will be displayed showing the Average procedure code. Note also, the Call Stack window now displays the procedure variables. The combo box displaying the call stack chain in that window shows two items: the top one is the Average procedure and the second one the Average test.
8. Select the second entry in the Call Stack combo box.
The Test is shown. Notice the green triangle mark next to the line that
called your procedure. This mark is the Call
Mark and it shows the line that called your procedure as shown
here:
![]()
9. To display the next statement select Show Next Statement from the Debug menu. The average is displayed again.
10. Set the insertion point in the line containing the
division of d with lSize.
Select the Toggle Breakpoint command
from the Debug menu or from the
Standard toolbar. A red Breakpoint Mark
will appear next to the line as shown here:
![]()
11. Select Continue from the Run menu. The debugger stops where you placed your breakpoint. At this point, you can examine the value of d in the Call Stack window.
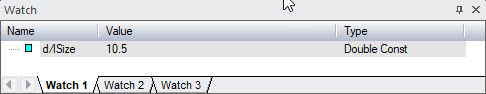
12. Open the Watch window by selecting Watch
from the View menu. The watch
window will show. Right-click on the view and select Insert
Watch At ![]() . Type d/lSize.
The value displayed should be 10.5
as shown here:
. Type d/lSize.
The value displayed should be 10.5
as shown here:
13. To complete this debug session select Continue or Abort from the Run menu.