You can run any active program in the active project inside the ATEasy development environment. The capability to run an application and debug code is one of the most important aspects of a test development environment. ATEasy provides multiple methods for running and debugging code.
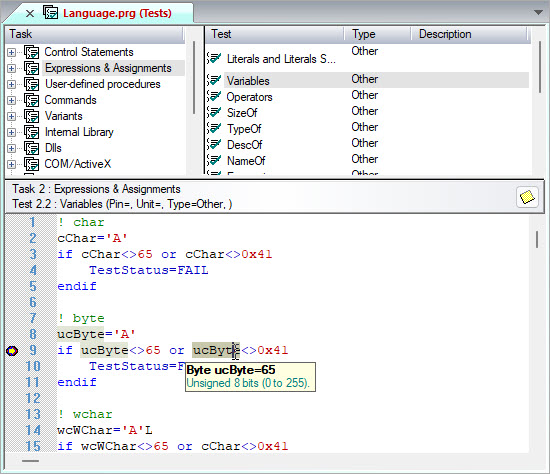
You can use run commands to debug programs. Run commands let you loop or skip tasks, or create program profiles to debug the Unit Under Test (UUT). Two of the frequently used Run commands are Continue/Pause and Abort. Continue and Pause allow you to run segments of a given program. When you pause a program, execution stops, and ATEasy places a yellow arrow in the left margin of your code at the line where the procedure is paused. You can pause a program to debug it. For example, pausing a program allows you to view the variables values in the Call Stack\Globals window, described below. The Abort command aborts the debugged application.
The debugging tools provided by ATEasy allow users to test any portion of the program without compiling the application. This ability saves a significant amount of time as each line of code may be executed individually and immediately verifying the validity of the code as it is created.
You can use debug commands to test and debug code. Some of the frequently used debug commands are DoIt!, Step Into, Step Over, Step Out, Toggle Breakpoint, and Run to Cursor. These commands let you execute code or portions of code, run programs in a step-by-step mode, set and remove breakpoints, and run to and from the cursor.
For a complete list of Debug commands, see Overview of Debug Menu Commands.
Several debugging Windows are also available as tools. The Call
Stacks/Globals Window displays the values of modules variables
and procedure variables when the application is paused. You can then change
the variable values. The Watch Window
allows you to type expressions to evaluate their value. ATEasy
calculates and displays the value of the expression every time the execution
pauses. The Call Stacks/Globals Window
and the Watch Window will retain
the (last)values of Global variables
even after the execution terminated.
During debugging multi-threaded applications Threads
Window is also available. When the application is paused, you can
open this window to display each thread with its Id and procedure where
it is paused at. If you select a thread, the call stack window will
display its stack and the current procedure (in document window) will
be displayed the current location of the thread.
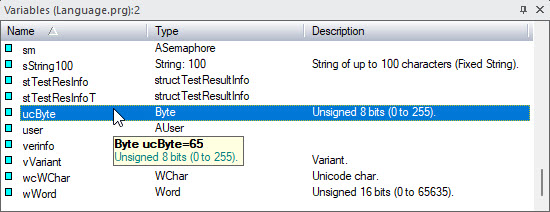
During debugging, when the application is paused, you can also view the values of variables in the code view as well as in the variables view. In the code editor, a tooltip window will be displayed to show the value of a variable over the cursor positioned (see below). During pause, you can select a variable in the variables view, it will also show the value of the variable, as shown below.
ATEasy contains two execution modes when executing code from the IDE. You can select lines from the code view and execute them – this is called Selection Run Mode. Alternatively, you can execute the application or a portion of your application (for example, a test). This is called Application Run Mode. You can start debugging using Selection Run Mode when the active view (the view with the input focus) is the code view. Use the Doit!, Loopit!, Formit!, and step commands. If the active view is not a code view, run mode is always used.