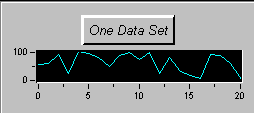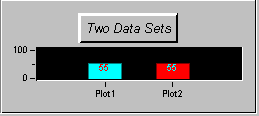

The AChart control displays one or more sets of data for the X axis versus one or more sets of data for the Y axis. AChart controls the display of this data by using a number of parameters, some set at design time, others set at run time. These attributes include, for example:
The Style of the chart: Line, Filled Line, Bar, 3-D Bar, and so on.
The Color of the plot’s lines, boxes, chart background, border areas, axis ticks, and so on.
The Text used as a caption for the graph, labels for the axes, and so on.
Each particular chart Style has its own sets of defaults for many of the chart’s attributes and properties. For example, the Line chart will by default plot one set of X and Y coordinates, whereas the Vertical Bar chart plots two sets of Y coordinates, using two distinct Plot objects. (A Plot object encapsulates the AChart control’s graphing of a given data set.)
|
|
|
Using the property pages of the AChart control, it is possible to set many of the chart’s attributes at design time.
When you want to fill the chart with data, you can use the SetData method to import data into the chart. You can import a batch of data previously captured using an array into which you have put the data, or you can use a looping procedure to plot captured data on the chart in real time.
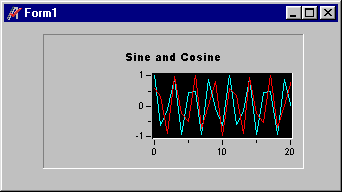
The following code illustrates how you can use the SetData method in a procedure, GenTrig(), to plot data for a sine wave. In this illustration:
frmTrig is a form variable of a type called TrigForm.
TrigForm has one control on it: the chart control, which is called cht.
The variables in GenTrig are: i : long, lPlot : long, adSin (an array of doubles dimensioned to 21), and adCos (an array of doubles dimensioned to 21)
load frmTrig, False ! Load the form (modeless mode)
print "<-- begin sine and cosine routine"
for i=0 to 20 do
adSin[i]=sin(i)
adCos[i]=cos(i)
next
frmTrig.cht.Caption = "Sine and Cosine"
!Insert plot object for sine
lPlot=frmTrig.cht.InsertPlot(-1)
! Scale axes.
frmTrig.cht.Axes("X-Axis").Min=0
frmTrig.cht.Axes("X-Axis").Max=20
frmTrig.cht.Axes("Y-Axis").Min=-1
frmTrig.cht.Axes("Y-Axis").Max=1
! Graph sine data
frmTrig.cht.SetData(lPlot, adSin)
! Insert plot object for cosine
lPlot=frmTrig.cht.InsertPlot(-1)
! Graph cosine data
frmTrig.cht.SetData(lPlot, adCos)
! print it to the log
for i=0 to 20 do
print i; "\t"; adSin[i]; "\t"; adCos[i]
next
! wait until for is closed
while frmTrig.hWnd
WaitForEvent() !don't consume 100% cpu
endwhile
frmTrig=Nothing
The resulting chart looks like this:
