Developing ATEasy applications is done using the ATEasy Integrated Development Environment (IDE). The IDE contains all the tools required to create an application, run debug and then build them to create Windows executable files.
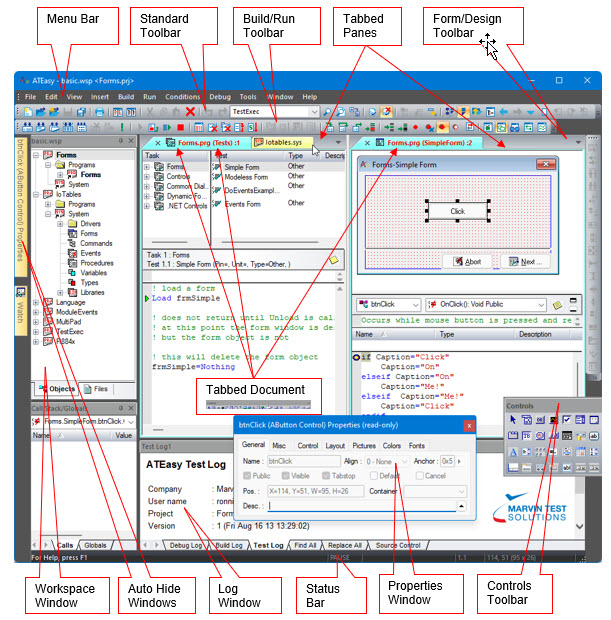
The following figure shows the main window of the IDE below with callouts to the individual windows.
The following windows are displayed:
● Menu Bar – contains the IDE menus that includes:
File commands – used for file operation commands such as: Open, Save and Print.
Edit commands – used for editing operations such as: Undo, Redo, Cut, Copy, Paste, Delete, Find and Replace.
View commands – used for changing the way you view documents, and to show or hide the workspace built-in windows such as: Workspace, Variables, Properties, Log, and Debug windows such as Call Stack/Globals, Watch, Debug and Monitor. The built-in windows are dockable, that is, they can be docked to either side of the main frame making them always visible.
Insert commands – used to insert code commands and statements to the code editor and to insert object such as variables, procedures, forms and more.
Build commands – used to perform syntax checking and to build the application to an executable file.
Run commands – used to start, abort or pause the application, and to perform test level debugging commands such as: Loop Task and Loop Test.
Conditions commands - used to set different run modes such as: to set conditions upon failures, Pause On Task/Test Failure and to set Log Failures Only condition, etc.
Debug commands – used to perform source level debugging commands such as Step Into, Step Over, Toggle Breakpoint and to debug small portions of your application with commands such as Doit!, and Taskit!
Tools commands – used to customize the IDE keyboards commands, menus and toolbars, to set the IDE options such as directories, and to manage users, password and access rights.
Help commands – provide commands to search and open the on-line Help.
The IDE's most common menu commands can be also displayed using the context menu which can be invoked using the right mouse button or by using keyboard shortcuts that are fully customizable.
● Toolbars – including the Standard toolbar used for common commands, the Build/Run toolbar used for common build and run commands, the Form Design toolbar used for form layout operations, and the Controls toolbar used for inserting controls to a form.
● Status bar – contains multiples panes displaying the status of the application when running (for example, Run or Paused) or other editing properties such as: current line and column, size of the selected control on a form and more.
● The Workspace window – displays the contents of the current workspace file in a tree like view. The tree displays all files opened by the IDE: project files, modules such as drivers, system or programs, and their submodules such as procedures and variables. The user can perform editing commands on the objects displayed in the tree. Double-clicking on an object will open the document view used to display and edit the object.
● The Properties window – displays the properties of the current selected object. The current selected object can be set by clicking on an object in any of the ATEasy windows. This properties window contains pages, each of which displays a partial list of the object properties. The user may change the object properties by changing the values displayed in this window.
The Log window – contains five log tabs.
The Test Log displays the test results when the application is running. The test log displays a report automatically generated by ATEasy when a test program is running. It can display the results in Text format or HTML format, which provides more formatting and options.
The Build Log displays the build progress and compiler errors. It also show file load errors such as missing documents or libraries when loading the workspace (v10).
The Debug Log displays trace statement output when the application is running.
The Find All tab displays results of the finding text using the Find dialog. Each result is displayed as a link allowing you to click and see the found text (v9).
The Replace All tab displays results of the replaced text using the Replace dialog. Each result is displayed as a link allowing you to click and see the found text (v9).
Debug windows – used to display debugging information about the running application. Includes the following windows:
Call Stack/Globals window – displays variables values of modules variables and procedures variables when the application is paused. The user can change values of variables.
Watch window – displays expressions that the user input to this window. When the application pauses, the expression is evaluated and it value is displayed in the window.
Debug window – used to type programming statements when the application is paused. The user can run the code to evaluate expressions and to perform certain operations at run time for debugging purposes.
Monitor window – used to display communication data between the application and a device (for example, an instrument) through an ATEasy interface (for example, GPIB).
Threads window - used to display current ATEasy threads' stack and to switch between the threads. The user can see each thread stack and local variables.
● Document View Window – displays a module and its objects. The window is divided into two panes by a vertical splitter. The optional left pane displays a tree view containing the module submodules and objects and the right pane displays the object being edited, which is selected in the right pane. Clicking on an object in the tree view will cause it to be displayed in the object view.
Once used, you will find that the IDE is consistent and object-oriented and is geared for rapid application development. This provides you with a tool that is fast, intuitive, and easy-to-use in order to create ATEasy applications.