Threads Window |
Version 7, modified v8 |
The Threads window displays the application created threads using CreateThread procedure during debugging when an application is paused. The window is useful for debugging a multi-threaded application. During debugging when an application is paused the Threads window displays each of the application thread in a single line (see below). The current thread is highlighted.
Each thread line shows the thread ID, thread Handle, UUT number that the thread belongs to (1 based number, v8) and its current thread Location. Thread Location can be a procedure, event or test where the current (code) statement of the thread is paused. You can switch the current thread by double clicking on the thread line.
Switching the thread will cause the other debug windows to reflect the current thread: Watch window expressions recalculated using the scope of the new thread and the Call Stack Window displayed the current thread call chain (stack) and current local variables for the current thread location.
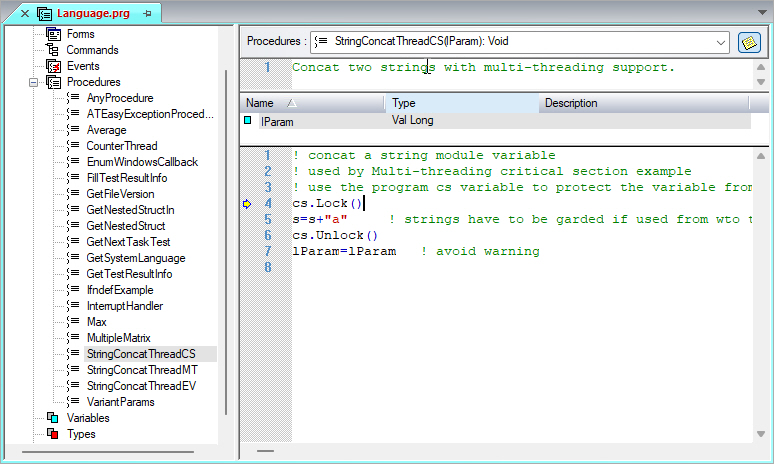
In addition, switching to another thread will cause the thread's current statement location to be displayed (see below).
You can select the Threads window ![]() by choosing it from the View menu or selecting
by choosing it from the View menu or selecting ![]() from
Build/Run toolbar.
from
Build/Run toolbar.
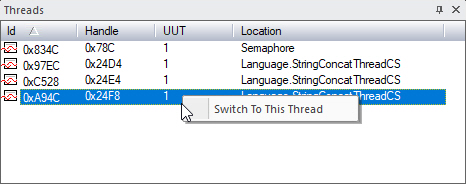
Clicking on Switch To This Thread command, will open a window showing the current statement in that thread: